
Basal Metabolic Rate (BMR) vs Resting Metabolic Rate (RMR): Formulas & Energy Expenditure
Master the critical differences between Basal Metabolic Rate and Resting Metabolic Rate — complete mathematical derivations, clinical formulas, organ tissue metabolic costs, and TDEE equations.
Every single second of every day, whether you are running a race, sitting at a desk typing an email, or resting in deep sleep, your body is continuously consuming chemical energy. Cells must maintain ionic gradients across membrane walls, your heart must beat over 100,000 times in 24 hours, your lungs must continuously contract the diaphragm, your kidneys must filter nearly 180 liters of blood plasma daily, and your brain must transmit trillions of neuroelectrical impulses. This baseline energy demand represents the fundamental metabolic cost of keeping a human being alive.
When you embark on any health journey — whether formulating a sustainable fat loss plan, designing a muscle-building surplus, or dialing in athletic nutrition — your first calculation is invariably your baseline metabolic expenditure. However, when using a basal metabolic rate calculator or researching nutrition science, you will immediately encounter two terms frequently used interchangeably yet representing distinct physiological concepts: Basal Metabolic Rate (BMR) and Resting Metabolic Rate (RMR).
What is the exact clinical distinction between BMR and RMR? How do classical formulas like the Harris-Benedict equation compare to the modern gold-standard Mifflin-St Jeor formula or body-composition-specific equations like Katch-McArdle? And how does physical body geometry, such as your total Body Surface Area (Mosteller), govern your heat dissipation and metabolic baseline? In this exhaustive master guide, we explore the science, mathematical formulas, tissue thermodynamics, and practical application of baseline metabolic rates.
BMR vs. RMR: The Clinical & Laboratory Distinction
While consumer fitness apps often treat BMR and RMR as identical synonyms, in clinical exercise physiology and human calorimetry, they represent measurements performed under substantially different environmental and physical constraints.
What is Basal Metabolic Rate (BMR)?
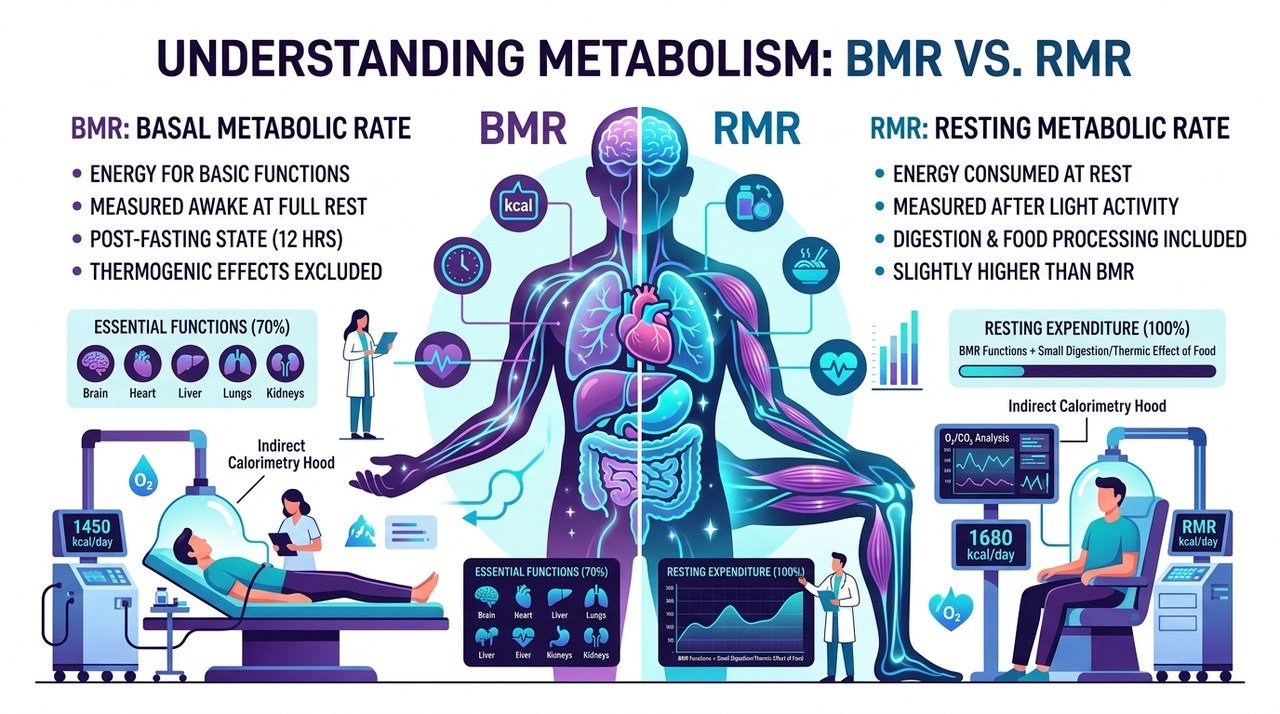
Basal Metabolic Rate (BMR) represents the absolute minimum energy expenditure compatible with human life. It is the lowest possible metabolic rate measured under strictly standardized, clinical laboratory conditions designed to eliminate all external thermogenic stimuli:
- Measurement Conditions: The subject must sleep overnight in the testing facility (or awake in an adjoining room) in a state of complete physical rest.
- Fasting State: Measured immediately upon waking in the morning after a minimum of 12 to 14 hours of continuous fasting, ensuring zero thermic effect of food digestion.
- Thermoneutral Environment: The testing chamber must be maintained at an ambient temperature of 22°C to 26°C (72°F to 78°F), preventing the body from expending energy to generate heat (shivering/non-shivering thermogenesis) or cool itself (sweating).
- Mental & Physical Inactivity: The subject must be measured lying flat on their back (supine), in a dimly lit, silent room, without stress, reading, or screen stimulation.
What is Resting Metabolic Rate (RMR)?
Resting Metabolic Rate (RMR) — also referred to in clinical literature as Resting Energy Expenditure (REE) — measures the energy consumed while a person is awake, comfortable, and resting quietly, but under less restrictive and more practical real-world conditions:
- Measurement Conditions: The subject can sleep at home, travel to an outpatient clinic, and sit or lie quietly in a reclined chair for 15 to 30 minutes before testing.
- Fasting State: Requires a shorter fast of 3 to 4 hours rather than a strict 14-hour laboratory fast.
- Activity Restraints: The subject must refrain from vigorous physical exercise for 12 to 24 hours prior, but standard low-intensity daily transit is permitted.
Why RMR is Typically 5% to 10% Higher than BMR
Because the clinical protocol for RMR allows for recent modest movement, residual digestion of a light meal, and daytime psychological alertness, an individual’s measured RMR is typically 5% to 10% higher than their true BMR (approximately 50 to 150 additional calories per day). In practical lifestyle coaching and dietary planning, this slight difference is easily accommodated within your daily caloric budgeting.
The Four Pillars of Total Daily Energy Expenditure (TDEE)
To contextualize where your BMR fits into your daily calorie burn, consider how your body allocates energy throughout a 24-hour cycle. Your Total Daily Energy Expenditure (TDEE) is divided into four primary metabolic compartments:
1. Basal/Resting Metabolic Rate (BMR/RMR): 60% to 75% of TDEE
By far the largest component of human daily energy expenditure. Even in highly active individuals, keeping your vital organs functioning, maintaining core body temperature, and running cellular metabolism accounts for the overwhelming majority of the calories you burn each day.
2. Thermic Effect of Food (TEF): 8% to 12% of TDEE
Digesting, absorbing, transporting, and metabolizing macronutrients requires energy expenditure. The energetic cost of processing food varies dramatically across macronutrients:
- Protein: 20% to 30% of its caloric value is consumed during digestion and metabolic synthesis.
- Carbohydrates: 5% to 10% of ingested calories are expended during enzymatic breakdown and glycogen storage.
- Fats: 0% to 3% of ingested calories are consumed during lipolysis and absorption.
3. Exercise Activity Thermogenesis (EAT): 5% to 15% of TDEE
Deliberate, structured physical workouts — such as weight training, running on a treadmill, swimming laps, or cycling. For non-athletes, structured exercise rarely accounts for more than 10% to 15% of total daily energy burn.
4. Non-Exercise Activity Thermogenesis (NEAT): 10% to 25% of TDEE
All spontaneous, unstructured physical movement that is not purposeful exercise: typing on a keyboard, fidgeting, pacing, carrying groceries, climbing stairs, and casual neighborhood walking. As discussed in our Calorie Deficit for Weight Loss Guide, NEAT is the most variable component of human metabolism, fluctuating by up to 800 calories per day between sedentary desk workers and active manual laborers.
The Major Clinical BMR Formulas Explained
Because indirect calorimetry (measuring gas exchange via a metabolic metabolic hood or breath analyzer) requires specialized clinical equipment, scientists over the past century have developed predictive mathematical formulas to estimate BMR with remarkable precision using easily measurable demographic variables: weight, height, age, sex, and body composition.
1. The Mifflin-St Jeor Equation (1990) — The Modern Gold Standard
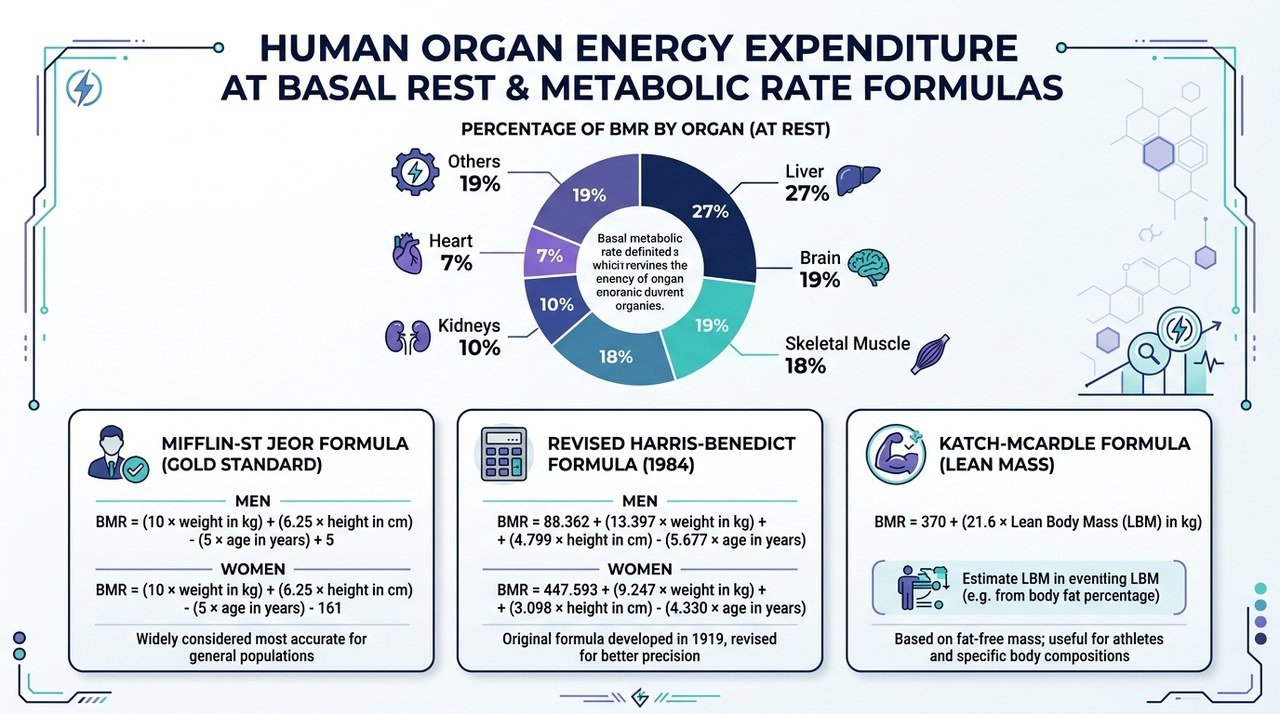
Published in 1990 by Dr. M. D. Mifflin and S. T. St Jeor in the American Journal of Clinical Nutrition, this equation was developed using modern calorimetry equipment across a large cohort of both lean and obese men and women. In 2005, the Academy of Nutrition and Dietetics (formerly ADA) conducted a comprehensive systematic review of all predictive equations and validated Mifflin-St Jeor as the most accurate formula for healthy adults, estimating BMR within ±10% of measured values in over 82% of individuals.
Formula for Men:
$ ext{BMR} = (10 imes ext{Weight in kg}) + (6.25 imes ext{Height in cm}) - (5 imes ext{Age in years}) + 5$
Formula for Women:
$ ext{BMR} = (10 imes ext{Weight in kg}) + (6.25 imes ext{Height in cm}) - (5 imes ext{Age in years}) - 161$
Worked Example: Mifflin-St Jeor
Let us calculate the BMR of a 35-year-old male who stands 5 feet 10 inches tall (177.8 cm) and weighs 180 pounds (81.65 kg):
- Weight factor: $10 imes 81.65 = 816.5$
- Height factor: $6.25 imes 177.8 = 1,111.25$
- Age factor: $5 imes 35 = 175$
- Summation: $816.5 + 1,111.25 - 175 + 5 = \mathbf{1,757.75 ext{ kcal/day}}$
His baseline basal metabolic rate is approximately 1,758 calories per day.
2. The Harris-Benedict Equation: Original (1919) vs. Revised (1984)
Developed at the Carnegie Institution of Washington by J. Arthur Harris and Francis G. Benedict in 1919, this was the foundational predictive equation in clinical medicine for over seven decades. However, because the original 1919 dataset utilized young, lean subjects from the early 20th century, it tends to overestimate BMR in modern populations by roughly 5% to 8%.
In 1984, researchers Roza and Shizgal published the Revised Harris-Benedict Equation, modernizing the regression coefficients:
Revised Formula for Men (Roza & Shizgal, 1984):
$ ext{BMR} = 88.362 + (13.397 imes ext{Weight in kg}) + (4.799 imes ext{Height in cm}) - (5.677 imes ext{Age})$
Revised Formula for Women (Roza & Shizgal, 1984):
$ ext{BMR} = 447.593 + (9.247 imes ext{Weight in kg}) + (3.098 imes ext{Height in cm}) - (4.330 imes ext{Age})$
3. The Katch-McArdle Formula (Body Composition Based)
While the Mifflin-St Jeor and Harris-Benedict formulas rely on total body weight, they do not differentiate between lean muscle mass and adipose fat tissue. Adipose tissue is metabolically inert compared to muscular, glandular, and visceral organs.
Developed by Frank Katch and William McArdle, the Katch-McArdle Formula calculates BMR strictly from Lean Body Mass (LBM) in kilograms. It is by far the most accurate formula for muscular athletes, bodybuilders, and individuals who know their verified body fat percentage:
$ ext{BMR} = 370 + (21.6 imes ext{Lean Body Mass in kg})$
Worked Example: Katch-McArdle
Consider an athletic individual weighing 200 lbs (90.7 kg) with a lean body composition of 12% body fat:
- Fat mass: $90.7 imes 0.12 = 10.88 ext{ kg}$
- Lean Body Mass (LBM): $90.7 - 10.88 = 79.82 ext{ kg}$
- Calculation: $370 + (21.6 imes 79.82) = 370 + 1,724.11 = \mathbf{2,094.1 ext{ kcal/day}}$
By comparison, if someone weighed the same 200 lbs but possessed 35% body fat, their LBM would be only 58.95 kg, yielding a Katch-McArdle BMR of just 1,643 calories per day — a massive 451-calorie difference driven entirely by body composition!
4. The Cunningham Equation (1980)
Similar to Katch-McArdle, the Cunningham equation is optimized for competitive endurance and strength athletes:
$ ext{BMR} = 500 + (22 imes ext{Lean Body Mass in kg})$
Body Surface Area (BSA) and Allometric Scaling in Human Metabolism
Why do predictive formulas use both height and weight rather than just weight? The answer lies in the fundamental biophysics of heat transfer: Rubner’s Surface Law.
In 1883, physiologist Max Rubner demonstrated that metabolic heat production in mammals is proportional to total Body Surface Area (BSA). Because humans are warm-blooded (homeothermic) organisms maintaining a strict core body temperature of ~37°C (98.6°F), metabolic energy must continuously be oxidized to replace the thermal heat radiated through the skin surface to the cooler surrounding environment.
Two individuals who weigh the exact same amount but possess different heights have markedly different surface-to-volume ratios:
- A person who is 6 feet 2 inches tall and 180 lbs has a longer, more elongated cylindrical surface area than someone who is 5 feet 5 inches tall and 180 lbs.
- The taller individual loses thermal heat more rapidly across their expanded skin surface, requiring a higher metabolic rate to maintain thermal equilibrium.
In clinical medicine and pharmacology, body surface area is calculated with high precision using the Mosteller formula:
$ ext{BSA (m}^2 ext{)} = \sqrt{ rac{ ext{Height (cm)} imes ext{Weight (kg)}}{3600}}$
You can calculate your exact physiological surface area using our interactive Body Surface Area (Mosteller) Calculator. Clinicians frequently use BSA to calibrate chemotherapy dosing, burn fluid resuscitation, and cardiac output indices ($L/ ext{min}/m^2$).
The Metabolic Cost of Human Organs & Tissues
A common fitness myth suggests that skeletal muscle burns the vast majority of your resting calories. While building muscle certainly raises metabolic rate, the true champions of resting energy consumption are your vital organs.
Although your four major internal organs — the liver, brain, heart, and kidneys — account for only 5% to 6% of your total body weight, they collectively consume over 58% of your Basal Metabolic Rate:
- Liver (approx. 1.8 kg / 2.5% of body weight): Consumes ~200 kcal/kg/day, accounting for roughly 27% of your BMR. The liver continuously synthesizes proteins, detoxifies metabolic waste, regulates glycogen stores, and manufactures bile.
- Brain (approx. 1.4 kg / 2.0% of body weight): Consumes ~240 kcal/kg/day, accounting for roughly 19% of your BMR. The brain exclusively relies on glucose and ketones to maintain neuronal action potentials and active ion pumping.
- Skeletal Muscle (approx. 28-35 kg / 40% of body weight): Consumes ~13 kcal/kg/day (~6 kcal/lb/day), accounting for roughly 18% to 22% of your BMR. While muscle burns fewer calories per kilogram at rest than organs, its massive volumetric share of total body mass makes it the largest malleable determinant of your metabolic rate.
- Kidneys (approx. 0.3 kg / 0.5% of body weight): Consumes ~440 kcal/kg/day, accounting for roughly 10% of your BMR. Filtering blood plasma against osmotic pressure gradients requires immense active transport energy.
- Heart (approx. 0.33 kg / 0.5% of body weight): Consumes ~440 kcal/kg/day, accounting for roughly 7% of your BMR. Continuous mechanical contraction and pumping of blood requires perpetual ATP turnover.
- Adipose Fat Tissue (approx. 15-30 kg / 20-35% of body weight): Consumes ~4.5 kcal/kg/day (~2 kcal/lb/day), accounting for only 3% to 5% of your BMR. Adipose tissue is energy-storage tissue, possessing minimal active metabolic machinery.
Physiological Factors Controlling Your Baseline Metabolism
Why do two people of identical height, weight, and age often display differing baseline metabolic rates? Several key biological variables govern your metabolic baseline:
1. Age & Sarcopenia
Between the ages of 20 and 60, human metabolism remains remarkably stable when adjusting for body composition. However, after age 60, average BMR declines by roughly 0.7% per year. The primary driver of this age-related decline is sarcopenia (involuntary loss of skeletal muscle mass) and a reduction in vital organ cellularity, rather than an intrinsic cellular defect. Resistance training and adequate protein intake largely mitigate this decline.
2. Thyroid & Endocrine Function
The thyroid gland acts as the body’s master metabolic thermostat. Thyroid hormones (triiodothyronine or $T_3$, and thyroxine or $T_4$) regulate the expression of sodium-potassium ATPase pumps and mitochondrial uncoupling proteins. In clinical hyperthyroidism, BMR can skyrocket by 30% to 50%, whereas in untreated hypothyroidism, BMR may drop by 15% to 30%.
3. Ambient Temperature & Thermoregulation
Exposure to cold environments triggers non-shivering thermogenesis mediated by Brown Adipose Tissue (BAT). Brown fat contains mitochondrial uncoupling protein 1 (UCP-1), which short-circuits cellular ATP production to generate pure thermal heat, temporarily elevating resting energy expenditure by 5% to 15%.
4. Biological Sex Differences
On average, biological women possess a BMR that is 5% to 10% lower than biological men of identical weight. This is primarily because women naturally carry higher essential adipose tissue percentages (for endocrine and reproductive health) and smaller skeletal muscle frames. When comparing men and women with identical Lean Body Mass, their BMR per kilogram of muscle is virtually indistinguishable.
Comprehensive BMR Reference Tables
Table 1: Baseline BMR Reference Matrix by Height & Weight (Mifflin-St Jeor)
Calculated for a 30-year-old adult:
- Height: 5'4" (163 cm)
- 120 lbs (54.4 kg): Men ~1,418 kcal | Women ~1,252 kcal
- 140 lbs (63.5 kg): Men ~1,509 kcal | Women ~1,343 kcal
- 160 lbs (72.6 kg): Men ~1,600 kcal | Women ~1,434 kcal
- 180 lbs (81.6 kg): Men ~1,691 kcal | Women ~1,525 kcal
- 200 lbs (90.7 kg): Men ~1,782 kcal | Women ~1,616 kcal
- Height: 5'8" (173 cm)
- 140 lbs (63.5 kg): Men ~1,571 kcal | Women ~1,405 kcal
- 160 lbs (72.6 kg): Men ~1,662 kcal | Women ~1,496 kcal
- 180 lbs (81.6 kg): Men ~1,753 kcal | Women ~1,587 kcal
- 200 lbs (90.7 kg): Men ~1,844 kcal | Women ~1,678 kcal
- 220 lbs (99.8 kg): Men ~1,935 kcal | Women ~1,769 kcal
- Height: 6'0" (183 cm)
- 160 lbs (72.6 kg): Men ~1,725 kcal | Women ~1,559 kcal
- 180 lbs (81.6 kg): Men ~1,816 kcal | Women ~1,650 kcal
- 200 lbs (90.7 kg): Men ~1,907 kcal | Women ~1,741 kcal
- 220 lbs (99.8 kg): Men ~1,998 kcal | Women ~1,832 kcal
- 240 lbs (108.9 kg): Men ~2,088 kcal | Women ~1,922 kcal
- Height: 6'4" (193 cm)
- 180 lbs (81.6 kg): Men ~1,878 kcal | Women ~1,712 kcal
- 200 lbs (90.7 kg): Men ~1,969 kcal | Women ~1,803 kcal
- 220 lbs (99.8 kg): Men ~2,060 kcal | Women ~1,894 kcal
- 240 lbs (108.9 kg): Men ~2,151 kcal | Women ~1,985 kcal
- 260 lbs (117.9 kg): Men ~2,241 kcal | Women ~2,075 kcal
Table 2: Formula Comparison Across Body Types
Comparing estimates for an individual weighing 185 lbs (83.9 kg), 5'10" (178 cm), age 32, across different body composition scenarios:
- Lean Athlete (12% Body Fat / 73.8 kg LBM):
- Mifflin-St Jeor: 1,795 kcal
- Revised Harris-Benedict: 1,884 kcal
- Katch-McArdle: 1,965 kcal (Accurately rewards high muscle mass)
- Cunningham: 2,124 kcal
- Average Fitness (20% Body Fat / 67.1 kg LBM):
- Mifflin-St Jeor: 1,795 kcal
- Revised Harris-Benedict: 1,884 kcal
- Katch-McArdle: 1,820 kcal (Closely matches Mifflin-St Jeor)
- Cunningham: 1,977 kcal
- Higher Adiposity (32% Body Fat / 57.1 kg LBM):
- Mifflin-St Jeor: 1,795 kcal (Slightly overestimates)
- Revised Harris-Benedict: 1,884 kcal (Substantially overestimates)
- Katch-McArdle: 1,602 kcal (Corrects for inert fat tissue)
- Cunningham: 1,755 kcal
Table 3: Physical Activity Level (PAL) Multipliers for TDEE
Once you calculate your BMR using our guidelines, multiply by your standard Physical Activity Level (PAL) to determine your Total Daily Energy Expenditure:
- Sedentary (BMR × 1.2): Little to no intentional exercise; desk job, low daily step count (< 5,000 steps).
- Lightly Active (BMR × 1.375): Light exercise 1 to 3 days per week; casual walking (5,000 to 7,500 steps).
- Moderately Active (BMR × 1.55): Moderate exercise 3 to 5 days per week; active lifestyle (7,500 to 10,000 steps).
- Very Active (BMR × 1.725): Hard exercise 6 to 7 days per week; highly physical job (10,000 to 15,000 steps).
- Extremely Active (BMR × 1.9): Rigorous athletic training twice daily or heavy manual labor (construction, military).
Metabolic Myths Debunked
Myth 1: "Starvation Mode Permanently Destroys Your Metabolism"
While prolonged hypocaloric dieting causes adaptive thermogenesis (a reduction in resting metabolic rate beyond what is predicted by weight loss alone — typically 50 to 150 calories), your metabolism is never "permanently broken." Once you return to maintenance calories and restore glycogen stores, endocrine signals ($T_3$, leptin) recover, and BMR normalizes to match your new body weight.
Myth 2: "Building 1 Pound of Muscle Burns 50 Extra Calories a Day"
This is a widespread gym folklore claim. As proven by clinical magnetic resonance spectroscopy, one pound of skeletal muscle burns approximately 6 calories per day at rest, whereas one pound of fat burns approximately 2 calories per day. Adding 5 pounds of solid muscle increases your resting daily expenditure by roughly 30 calories. The primary metabolic advantage of resistance training is not resting burn, but the immense caloric cost of muscular recovery, insulin sensitivity, and high physical work capacity.
Myth 3: "Eating Six Small Meals Boosts Your Metabolism"
The total Thermic Effect of Food (TEF) is determined strictly by the macronutrient composition and total caloric volume of your food, not eating frequency. Eating 2,000 calories divided into six meals burns the exact same thermic digestion calories as eating 2,000 calories divided into two meals.
Frequently Asked Questions (FAQ)
What is the difference between BMR and RMR?
BMR (Basal Metabolic Rate) is measured under strict clinical laboratory constraints: after an overnight stay, a 12-to-14-hour fast, in a thermoneutral environment, immediately upon waking. RMR (Resting Metabolic Rate) is measured after a shorter 3-to-4-hour fast, allowing real-world travel to a clinic. As a result, RMR is typically 5% to 10% higher than BMR.
Which equation is the most accurate for calculating BMR?
For the general population, the Mifflin-St Jeor equation is the most widely validated and clinically accurate formula, endorsed by the Academy of Nutrition and Dietetics. However, for muscular athletes with a known body fat percentage, the Katch-McArdle formula is superior because it calculates metabolic burn directly from Lean Body Mass.
Can you increase your BMR?
Yes. The most effective long-term method to elevate your BMR is increasing your Lean Body Mass through progressive resistance training and adequate dietary protein intake. Additionally, avoiding crash diets that trigger severe muscle wasting ensures your metabolic baseline remains robust.
Should I ever eat below my BMR?
For most individuals, eating below your BMR for extended periods is not recommended. Your BMR covers the baseline energy required by vital organs (heart, brain, liver, kidneys). Setting your daily intake substantially below your BMR can lead to micronutrient deficiencies, muscle catabolism, severe fatigue, and hormonal down-regulation. Aim for a moderate deficit relative to your TDEE rather than cutting below your BMR.
How does body surface area relate to metabolic rate?
Human bodies generate heat internally and radiate heat through the skin. According to Rubner’s Surface Law, individuals with a larger Body Surface Area (BSA) radiate thermal energy more quickly and require a proportionally higher metabolic rate to maintain core temperature. You can evaluate your surface area with our Body Surface Area (Mosteller) Calculator.
Conclusion & Key Action Plan
Your Basal Metabolic Rate is the primary cornerstone of your daily energy equation. By calculating your numbers with verified scientific formulas, you eliminate guesswork and build a sustainable nutritional roadmap:
- Calculate your baseline: Use the Mifflin-St Jeor formula (or Katch-McArdle if you know your lean body mass) to determine your BMR.
- Determine your TDEE: Multiply your BMR by your realistic Physical Activity Level (PAL) multiplier.
- Set purposeful targets: If your goal is fat loss, create a sensible 300-to-500 calorie deficit below your TDEE as outlined in our Calorie Deficit for Weight Loss Guide. If your goal is muscle hypertrophy, add a controlled 200-to-300 calorie surplus.
- Monitor body metrics: Track your progress using our Body Mass Index (BMI) Calculator and re-evaluate your BMR every 10 to 15 pounds of weight change to account for your evolving metabolic mass.